A proven concept with 3 elements:
1. Data software Aquamoni
2. Smart sensors
3. In factory training
Aquamoni is the natural result of 52 years of experience in measuring losses in waste water. As of 2009 we have focused on developing a strong combination of smart sensoring and software. With the new web application we present now, we have built an unprecedented tool for cheese factories: it measures in real time the concentrations and loads of specific products in waste water, 24/7/365. Every minute of the day!
The sensor makes the invisible visible! A great asset in modern factories where it is really hard to see where products are lost since the waste water typically is disposed of underground.
By using the web application Aquamoni you obtain a safe and reliable live insight into product losses. This information is available to every stakeholder so that all involved have the same data.
Saving on product losses through waste water is an interplay of data, processes and people. That’s why we will train users to ensure they can realize those savings without external oversight.
Specifics
We measure the pollution in waste water with smart sensors which are installed in the factory sewers. The sensors have been trained to recognize specific products and their quantity by the percentage of dry solids in the water.
In a cheese factory we measure the losses of whey protein, fat and lactose per object. These losses are shown in real time.
Visualization of Detailed Information per product loss

We then combine the sensor data with data from the factory.
Through the output of combined data, an operator may take immediate action to reduce losses. A technologist may analyze the data and find out which settings are best; together we look for the ‘golden run’. A manager may compare the data to see how improvements in the factory are progressing.
Visualization of Object, COD per min and the composition of product losses

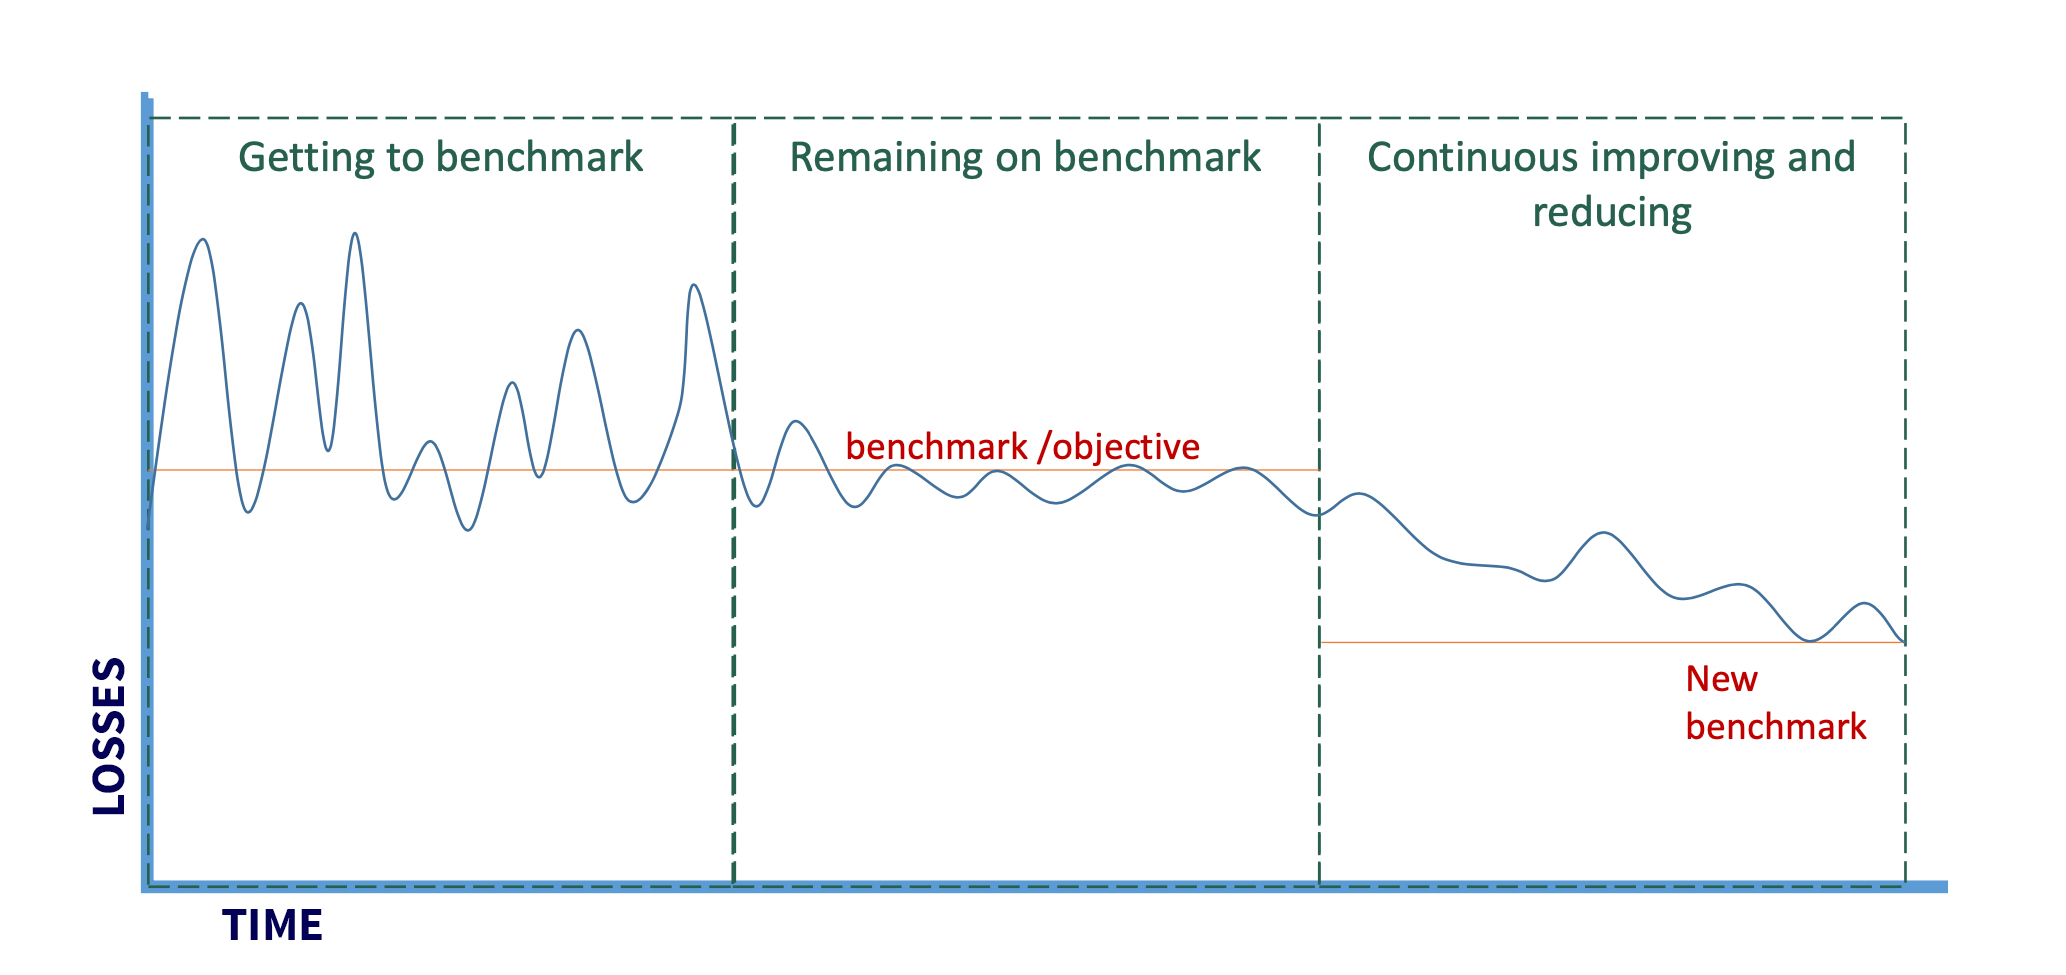
We also compare the total data to our benchmark figures. We can tell what is normal and what is not. This is done automatically with our software.
Visualization of Losses Compared to Benchmark
Aquamoni is not a future technology, it is available now!
WANT TO KNOW WHAT WE CAN ACHIEVE TOGETHER?
Click below, leave your number and we’ll get back to you.